
Water Vulnerability Map
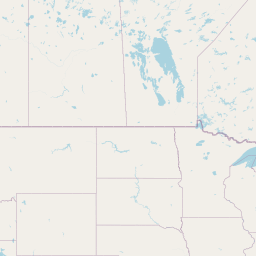
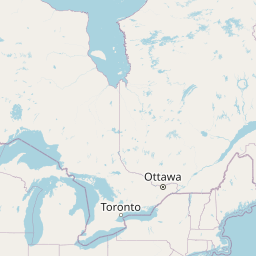
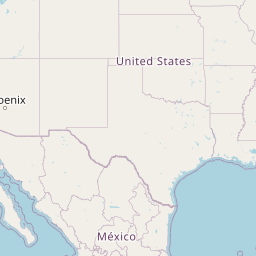
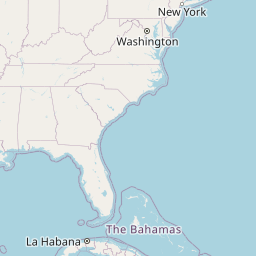
Data Center Water Stress Map
Major data center clusters across the U.S. overlaid with regional water stress indices. Red zones indicate critical depletion risk where tech companies' cooling demands are most problematic.
14 facility clusters shown
Critical Stress
Severe aquifer depletion risk
High Stress
Elevated depletion risk
Moderate Stress
Manageable but notable stress
Low Stress
Renewable water sources




🔴 Critical Stress Zones
3
Arizona, Utah, Phoenix region
🟠 High Stress
1
Texas, moderate risk
💧 Total Capacity
3,020 MW
filtered view
📊 Annual Consumption
6.6B gal
from these clusters
Why Water Stress Matters for Data Centers
Data center cooling accounts for 15–20% of facility power. In drought regions, aquifer refill cycles take 30–50+ years. Companies in red zones consume more water annually than many municipalities, yet aquifer depletion is rarely factored into sustainability claims. Our map exposes the hidden water cost of cloud infrastructure.