
National Well Contamination Map
Contamination sites compared against EPA limits across the United States — sourced from EPA, state DEP/DOH, ATSDR, EWG, DOD & USGS public records
Filters
State
EPA Limit Status
Contamination Sites (123)
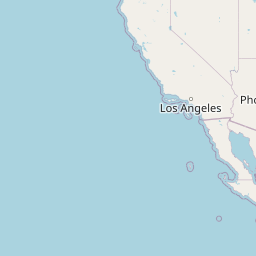


Map Legend — Color by EPA Limit Proximity
Official Data Sources
Contamination data compiled from verified government, academic, and nonprofit public records. All links below are primary sources.
EPA Safe Water Information System (SDWIS)
EPA database of public water systems, violations, and compliance nationwide
EPA ECHO — Enforcement & Compliance
EPA enforcement and compliance history for regulated facilities nationwide
EPA Superfund Sites
EPA Superfund and contaminated site listings by state
ATSDR PFAS Studies
Agency for Toxic Substances — community PFAS exposure health studies
EWG PFAS Contamination Map
Environmental Working Group national PFAS contamination tracker
EPA Unregulated Contaminant Monitoring
UCMR data on emerging contaminants in public water systems
USGS Groundwater Data
Real-time groundwater level monitoring stations across the United States
DOD PFAS Task Force
Department of Defense PFAS cleanup at military installations
Data Disclaimer: Contamination levels shown reflect publicly documented peak measurements from official government sources. Marker colors are calculated as the ratio of measured value to the EPA limit for that contaminant. Markers pulse when readings are at or above 75% of the EPA limit. Actual current levels may differ. This map is for informational and advocacy purposes. For health decisions, consult your county or state health department. Private well owners are strongly encouraged to test annually — find a certified lab through EPA's drinking water lab certification program.